Maybe you’re on a site for maintenance, a service call, or to install a new device. You’re making a bunch of big changes that will affect the BACnet network. You need to show the client that the changes you made have helped — or at least, haven’t hurt — the network. But how do you give concrete proof? Where do you even get this proof?
If you’re submitting network updates to clients and supervisors, you need reports. Whether the person you’re reporting to is a BACnet guru or a newb, they’ll get everything they need in a single PDF. You can show a before and after of the network health, and track changes over time. In Visual BACnet, we actually have two tiers for reports: basic and advanced. The two offer very different levels of detail, depending on how deep you want to dive. Read on for a breakdown of what to expect out of basic and advanced reports!
Advanced reports vs basic reports
Advanced reports are an account add-on that you can buy individually or in sets of 10. They break down all of the information you’d expect from the online Visual BACnet platform.
The basic report level comes free with every Visual BACnet account. It summarizes some of the core data you’ll find in the program.
Advanced reports
What's included?
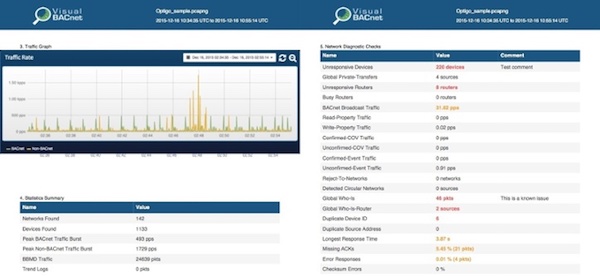
- Summary dashboard
- PCAP file information
- BACnet and non-BACnet traffic graph
- Statistics summary
- Network diagnostic checks and their values, colour-coded for pass, warning, and failed checks
- Appendix of all the offenders in the warning and failed diagnostic checks
If you’re submitting reports to a client or supervisor, these reports are a must. Here are just two ways you can leverage the power of advanced reports:
1.Reports in your service offering
You commission your sequences and your inputs and outputs — but what about your networks? Add Visual BACnet as a service offering to your current clients and increase the value of your contracts! Provide network reports on a quarterly or monthly basis, and use the easy to understand network health score to communicate the status of the customer’s system. Baseline and track changes over time so that when something goes wrong you know exactly what has changed.
2. Reports for project sign-off
Whether it's a contractor signing off on a job, a tech leaving a site, or new construction handing off to service, advanced reports prove that the work has been done. The network health ensures work is done to the same standard every time, and sign-off doesn't happen until the network is stable.
Basic reports
What’s included?
- Summary dashboard
- PCAP file information
- Statistics summary
If you only need a quick summary of your network’s health, basic reports are just fine. You’ll get fundamental info, and can track network health over time.
Whatever you’re looking for, Visual BACnet’s reports are tailored to your needs.